<%NUMBERING1%>.<%NUMBERING2%>.<%NUMBERING3%> PRTG Manual: Historic Data Reports
For quick reporting of a sensor's monitoring data, use the historic data reports as an alternative to the comprehensive Reports function. You can run and view a report of the historic data for each single sensor, on demand. Additionally, you can export this sensor data to your computer for further processing in external applications.
There are two possibilities to call the function for historic data reports: Either you click on the Historic Data tab on a sensor's detail page, or you choose Sensors | View Historic Data from the main menu.
Pages of probes, groups, devices, and sensors have an interface providing tabs. By using the tabs you can navigate through various sub-pages of an object to show your network's status, view monitoring results, or change settings.
Tabs Bar on Sensor Pages
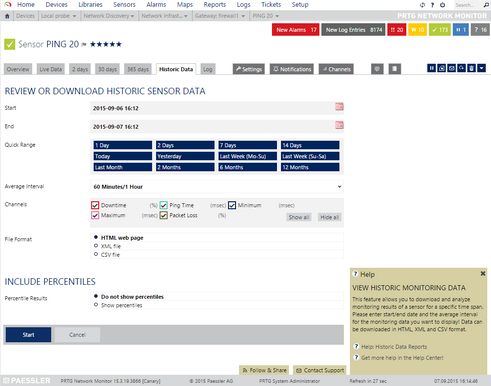
The Historic Data tab is available for sensors only (not for probes, groups, or devices). When you call the historic data reports via this tab, there is no sensor selection available because you already determined which sensor you want to create a report for. If you want to select another sensor for the report, choose Sensors | View Historic Data from the main menu in the PRTG web interface.

Historic Data Tab of Ping Sensor
Click here to enlarge: http://media.paessler.com/prtg-screenshots/historic_data_tab_ping_sensor.png
Historic Monitoring Data (Sensors Main Menu)
When you call historic data reports via the View Historic Data entry from the Sensors tab in the main menu, you additionally have to choose the sensor you want to create a report for with the Object Selector.
Historic Monitoring Data Settings
Settings |
|
|---|---|
Sensor |
This field is only visible if you call the historic data function via the main menu. Select the sensor you want to create the report for: Click on the reading-glass symbol to open the object selector. For more information, see section Object Selector. |
Start |
Specify the start date and time of the data you want to review. Use the date time picker to enter the date and time. |
End |
Specify the end date and time of the data you want to review. Use the date time picker to enter the date and time. |
Quick Range |
In this section you can use several buttons for a faster selection of start and end dates. Click on any of these links to change the Start and End values above. Choose between:
|
Average Interval |
With this option, you can activate and set up averaging. Select an interval for which PRTG calculates the average value. You can choose between No Interval (no averaging is performed and only raw data displayed), a few seconds, minutes, hours, or a whole day (24 Hours). A smaller interval results in a more detailed report for this sensor. The best settings for you vary, depending on the scanning interval of the sensor, the selected date period and, of course, the intended use for the report. It might be useful to try different settings to see what the results look like. Please also see the section Automatic Averaging below. |
Channels |
Select the channels you want to include in the report. You can select or deselect single channels with the respective check boxes, and select or deselect all channels with the buttons Show all or Hide all. PRTG shows only the data of selected data in the report. |
Cluster Node |
This field is only visible if the sensor is running on a cluster probe. Select the cluster node's data that PRTG uses for the report. Choose between:
|
File Format |
Select the output format for the report. Choose between:
|
Include Percentiles |
|
|---|---|
Percentile Results |
Define if you want to include an additional percentile calculation of your data in the report. Choose between:
Note: Percentiles are not available for all report templates. If a template does not support percentiles, they will simply not show up in the report, even when you enable this setting. Likewise, percentiles are not available if in a cluster setup you choose the option All Nodes in the Cluster setting in the sensor section above. |
Percentile Type |
This setting is only visible if you select Show percentiles above. Enter the percentile type you want PRTG to use for the calculation. If you choose, for example, to calculate the 95th percentile, enter "95" here and 5 % of peak values will be discarded. Please enter an integer value. |
Percentile Average Interval |
This setting is only visible if you select Show percentiles above. Enter a value to define the averaging interval on which PRTG bases the percentile calculation. The default value is 300 (seconds), which is equivalent to 5 minutes. This means that PRTG takes 5 minute averages as basic values for the percentile calculation. Please enter an integer value. |
Percentile Mode |
This setting is only visible if you select Show percentiles above. Choose the mode for percentile calculation:
|
Click Start to generate a historic data report.
Note: Data reporting is limited to 5 requests per minute.
Note: Reports cannot show uptime or downtime data for the Sensor Factory Sensor.
For performance reasons, PRTG automatically averages monitoring data when calculating data for large time spans. Data is then averaged regardless of the selected average interval.
Time Span in Report |
Minimum Level of Detail (Average Interval) |
Up to 40 days |
Any |
40 to 500 days |
60 minutes/1 hour or larger |
A report for a time span of more than 500 days is not possible. If you try to set a larger time span, it will be reduced to 365 days automatically.
Knowledge Base: Why is there missing data in historical data reports?
Other Ajax Web Interface Sections |
|---|
Related Topics |
|---|
Keywords: Averaging,Percentiles

